What Is the Yaw Angle?
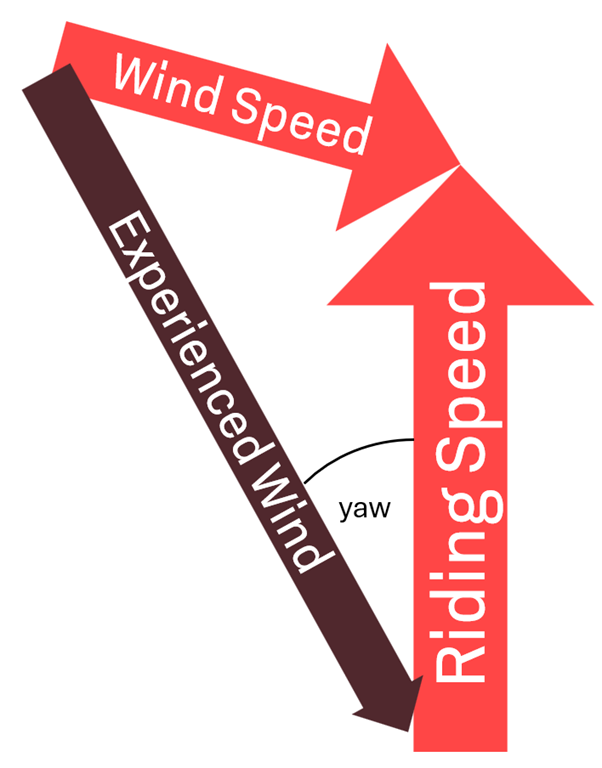
The yaw angle is the angle between the direction of the wind a rider is experiencing and the direction they are riding. For example, if there is no ambient wind, the yaw is zero because all the wind you are experiencing is coming straight at you. If you are riding at 30 km/h and there is a 15 km/h wind coming at 90° from your riding direction, yaw is 30°, because that is the direction the air is moving relative to you.
Why Is Yaw Important?
Although we think of Cd (coefficient of drag) as a constant, it changes with wind direction. Wheels in particular, but also frames, can be very sensitive to wind direction. Some wheels can claim to have negative drag at certain yaw angles, meaning they will push you forward even when the wind is against you.
There is another phenomenon called stall when the yaw angle reaches a certain point. At that point, the air can no longer follow the profile, it detaches and becomes turbulent. Depending on how abruptly this happens, it can cause serious handling issues in crosswinds, especially if the front wheel is affected. Drag also tends to increase rapidly beyond the stall point. Not surprisingly, a lot of effort in bicycle aerodynamics has gone into delaying the stall. This can be seen in the much more voluminous, rounder rim profiles we are used to seeing today, compared to the much more V-shaped profiles of early aero rims. All of these efforts have resulted in aerodynamic profiles that perform exceptionally well at yaw angles of 10°-20°. But that leads to the next question:
What Yaw Angles Are Relevant?
There is no definitive answer to this question, but it mainly depends on two factors: how fast you are going, and how windy it is where you are riding. Depending on these two factors, you can come up with a weighing function that averages the drag at different yaw angles to give you an accurate reading. This is what most magazines and brands do because a single number for drag reduction is much easier to understand. However, it is also a great tool to manipulate the numbers in a way that makes you look good or aerodynamics more relevant.
The usual approach is to assume a cruising speed and then use wind data to create a probability distribution. As an example, we used wind data from Freiburg, Germany, which is publicly available. The wind follows a Weibull distribution, the parameters of which are included in the published data. Now, the next important step is to realize that this wind data comes from 10 m above the ground, and the wind is slower near the ground. Fortunately, there is a formula to correct for this. Assuming that the wind direction is randomly distributed, we can use the Monte Carlo experiment to create a probability distribution. If we fit a standard probability distribution to it, we get a standard deviation of 9.5° for a riding speed of 35 km/h, which is close to the 10° used in many publications. If we increase the speed to 45 km/h, the standard deviation drops to 7.2°.
However, we feel that this overlooks an important aspect, which is that we benefit much more from aerodynamics when we have high wind speeds. So instead of a fixed speed we should use a weighted average speed, the cubic average speed. As we know, the power required to overcome drag increases with the cubed speed. To be realistic, we should exclude descents where speed is limited by safety and bike handling rather than drag. If we do this, the standard deviation of our weighting function will become smaller.
Also, riding in a group, in traffic, or on roads that are sheltered from the wind will all reduce the yaw angle. It seems that we typically assume yaw angles that are on the high side, and there are reasons for this.
The Power of the Weighting Function
As discussed earlier, a lot of aerodynamic optimization is about delaying stall. But at the same time, the weighting function tells us that low yaw is the most important. This seems contradictory, but there are good reasons why a lot of development goes into higher yaw aerodynamics. The first is that improving drag at zero yaw results in profiles that perform very poorly at higher yaw, and have very abrupt stalls that can lead to serious handling problems. Also, you can get much more improvement at higher yaw angles and by delaying stall than by reducing drag at zero yaw. If you look at graphs like the one below, a lot of bikes are pretty close in drag at zero yaw, but then the differences get bigger at higher yaw.
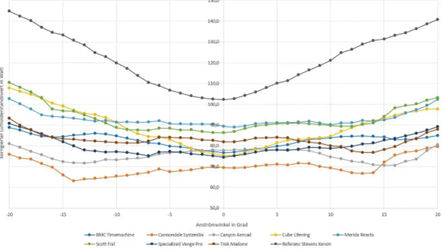
This also means that if we give more weight to higher yaw, the average improvements will be greater. Of course, this helps when you want to tell a story about improved aerodynamics.
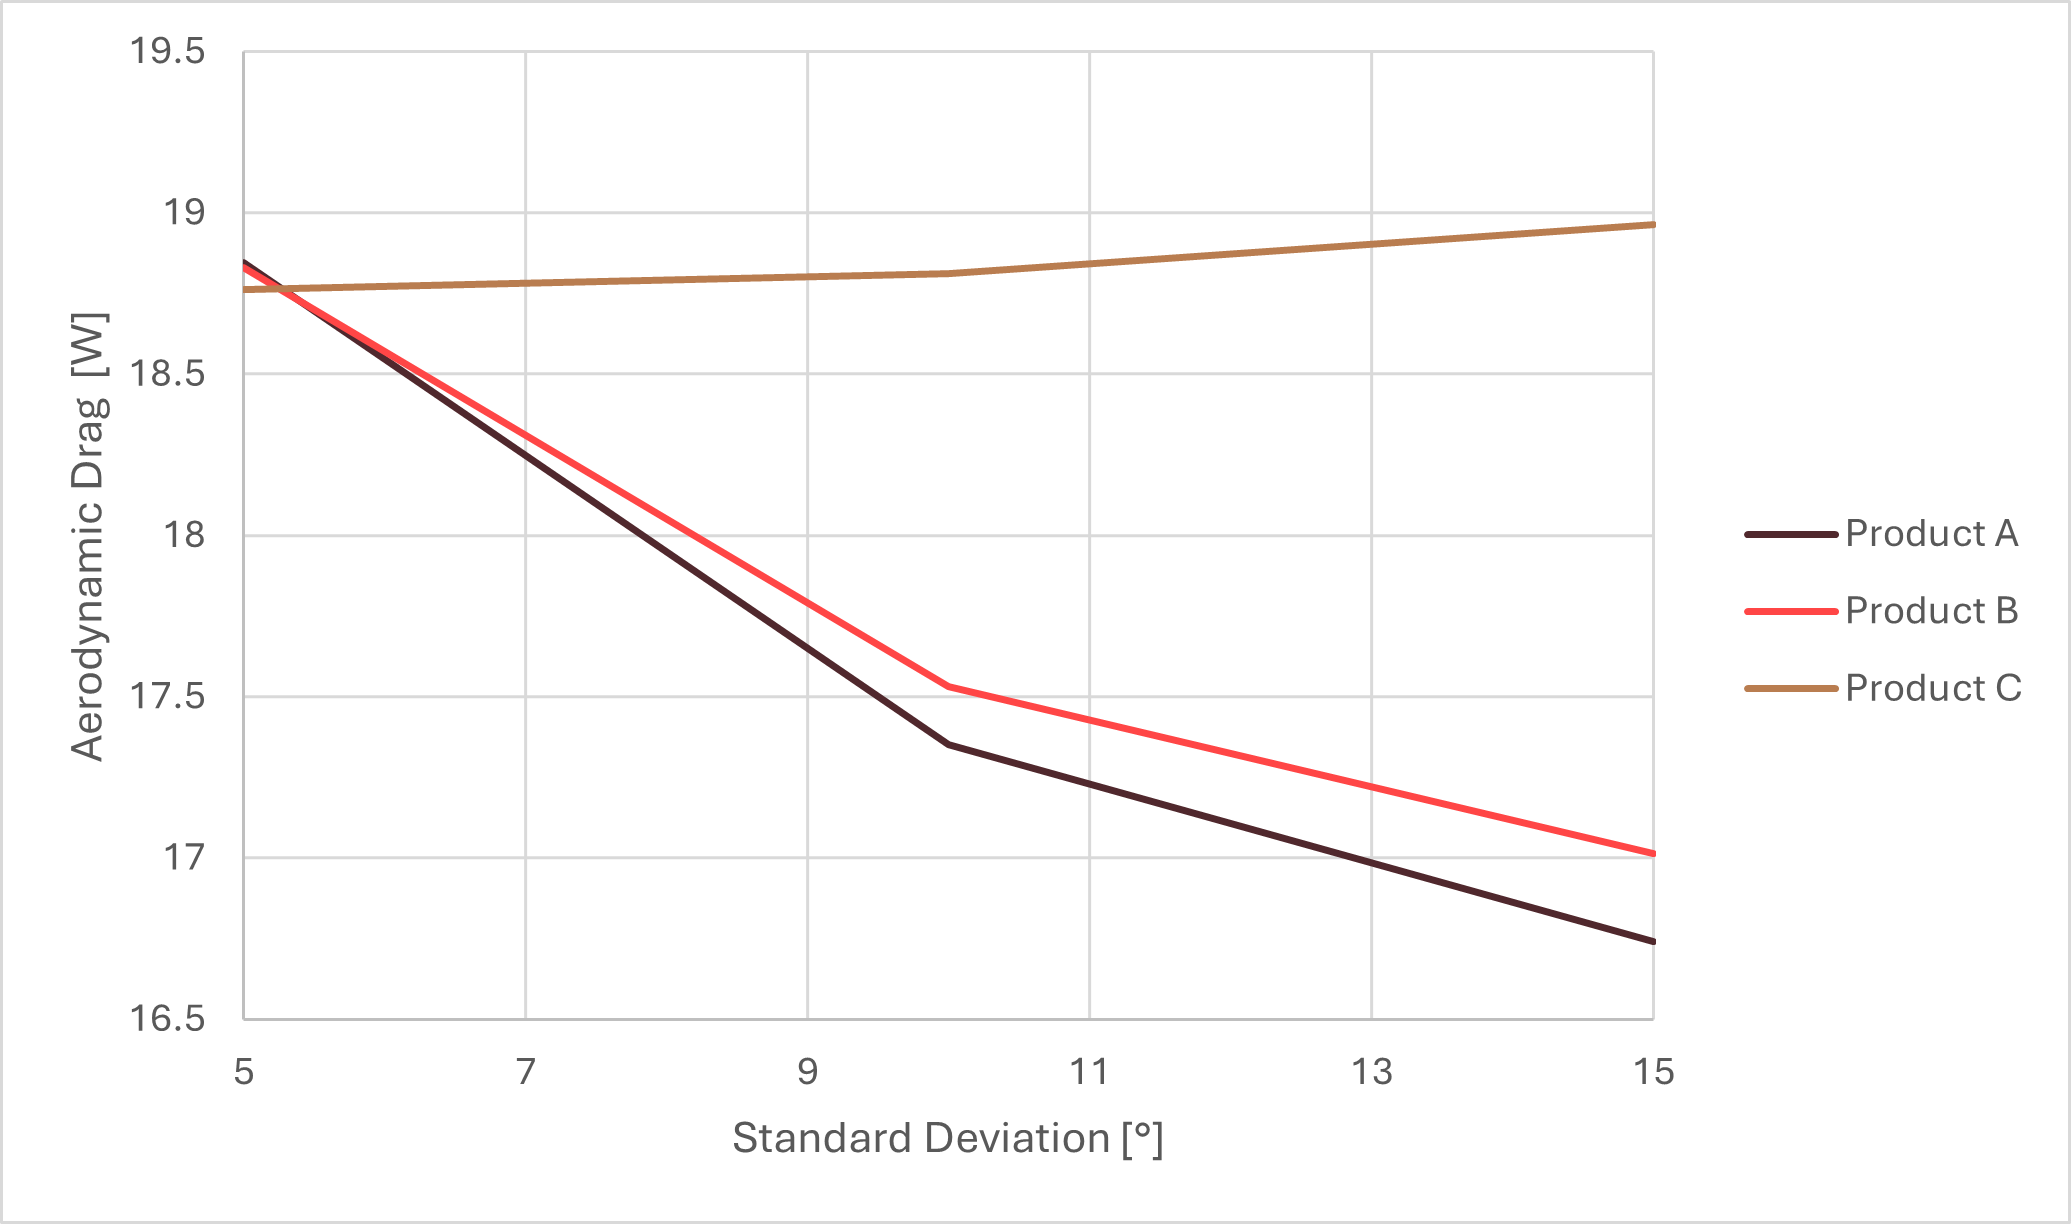
As an example, consider a recently introduced product, let's call it "Product A." All of its marketing is based on aerodynamics, claiming reduced drag and improved handling compared to their product B, which was already known to perform well. Their competitor has product C, which is known not to perform well aerodynamically. And this can be argued to be true if we look at the results of an independent wind tunnel test.
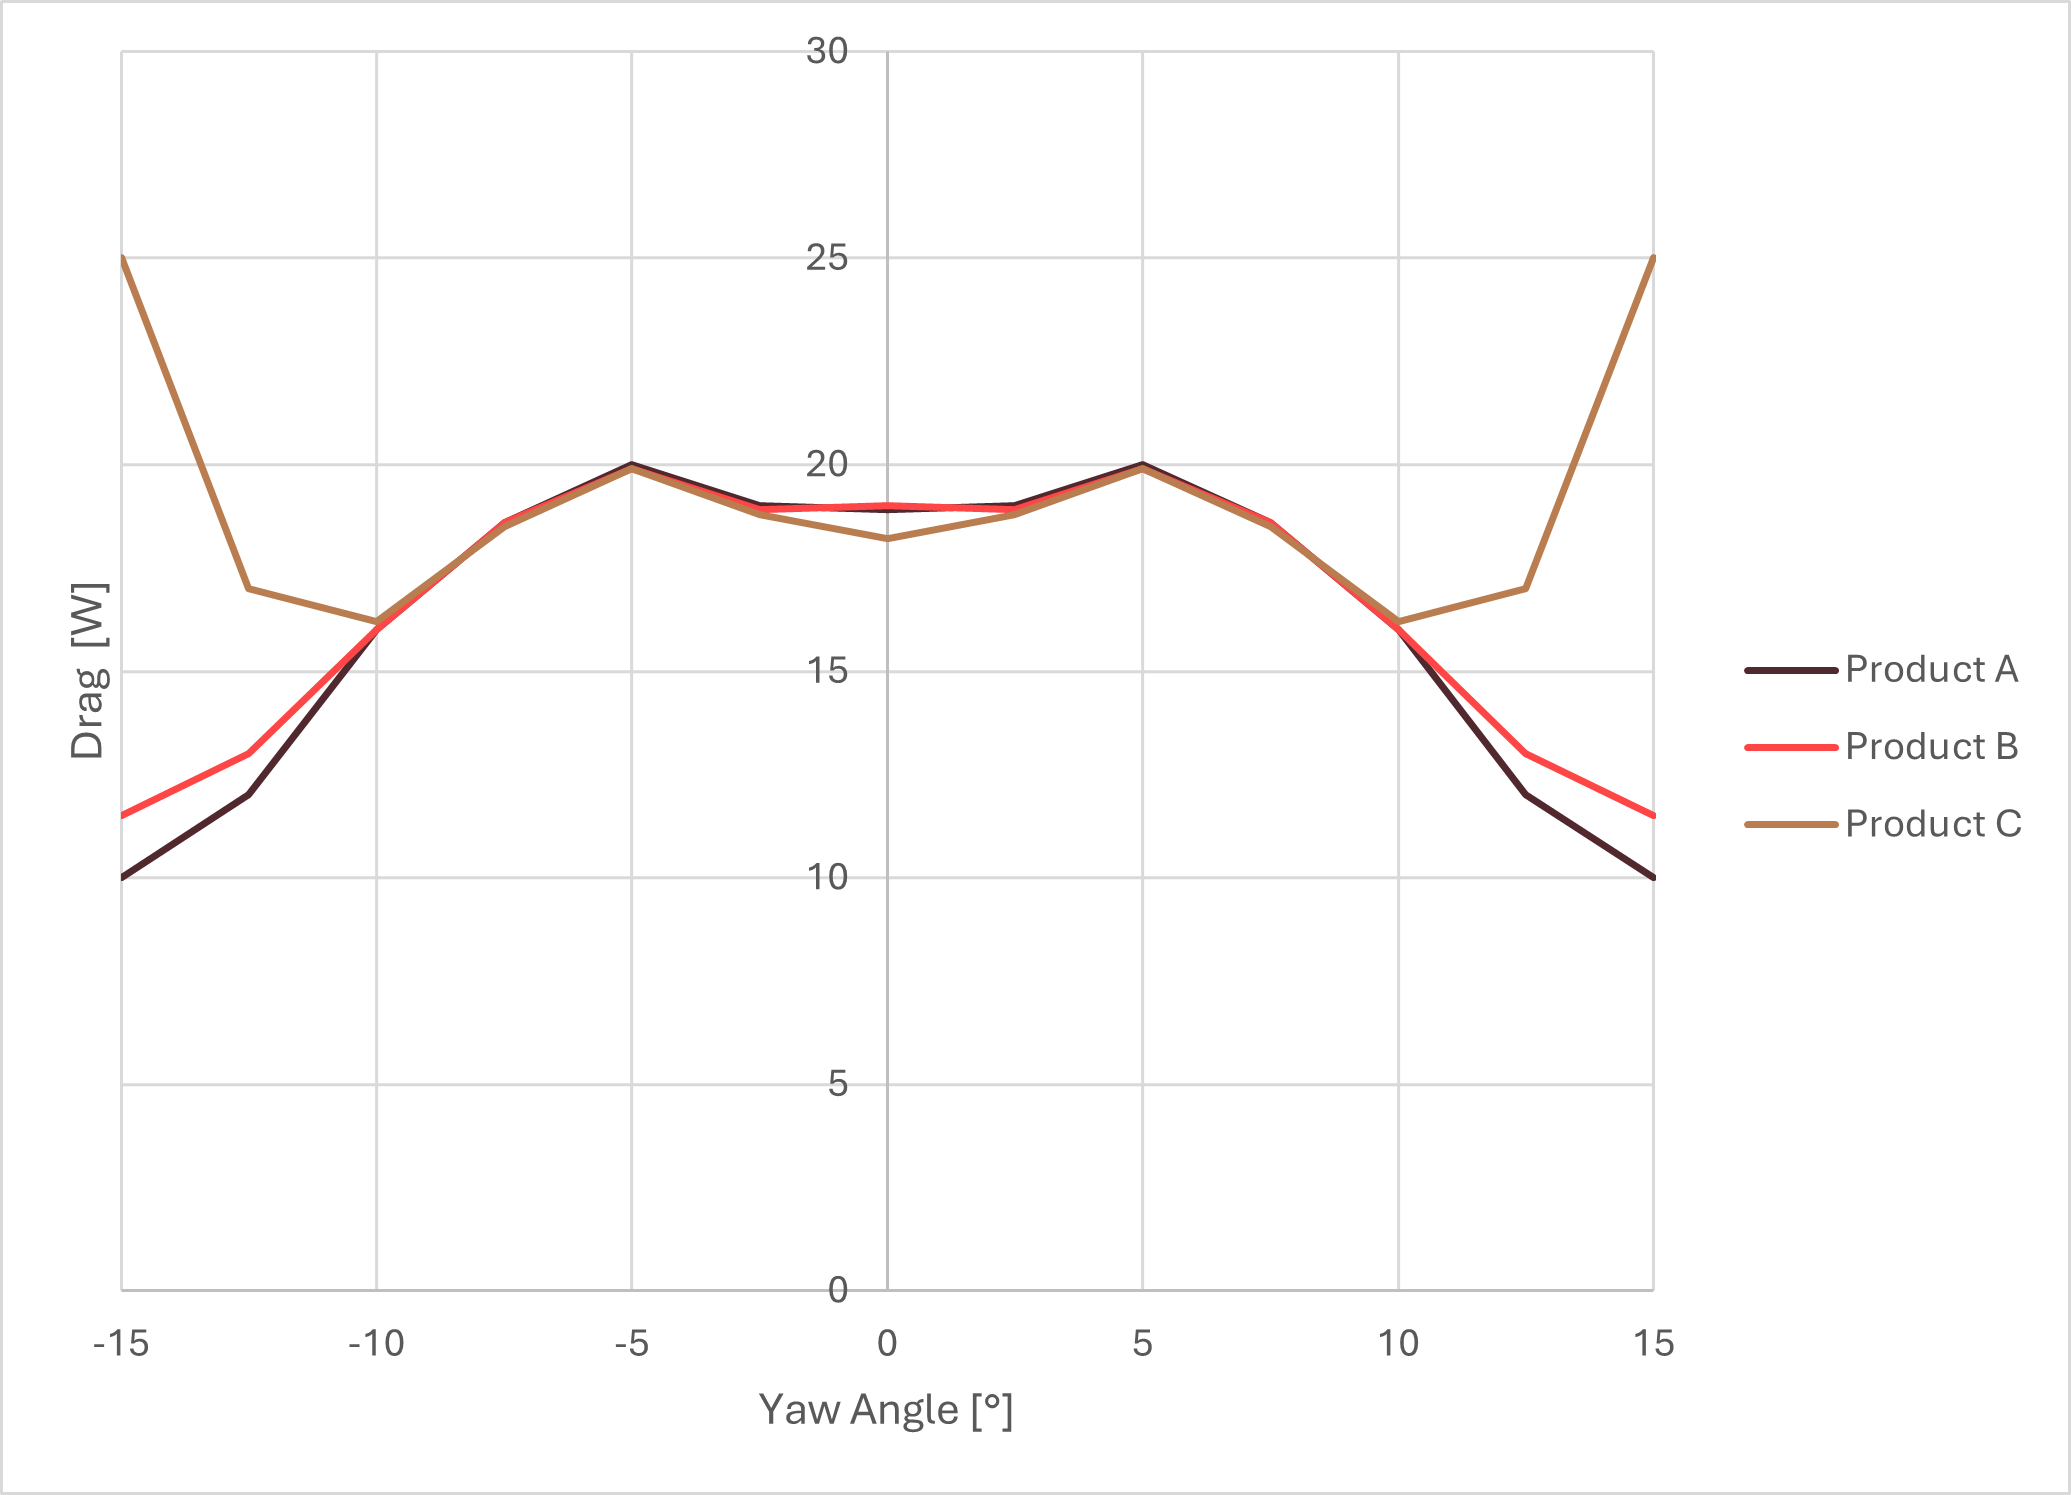
A closer look shows that all three products perform almost the same up to 10° of yaw. In fact, Product C is slightly better here, but then it stalls badly. Now, Product A's brand can legitimately claim improved handling and reduced drag, especially at slower speeds where you experience higher yaw. But Product C's brand can also claim lower drag, simply by using a different weighting function that prioritizes high speed and low yaw, where drag dominates.
This illustrates how the weighting function is a great tool for steering results while staying true to the facts.
The Limitations of Real-World Testing
In recent years, aerodynamic testing on the road has become popular. But yaw is a real problem in on-road testing. The Virtual Elevation Method (also known as the Chung Method) is a great, low-cost tool, but it does not account for yaw and is best used on days with low wind speeds when you do not experience yaw. Aero sensors can measure yaw and, at least in theory, could give you yaw-dependent results. But what yaw angles you can measure and how many data points you get depends on the wind conditions. In the wind tunnel, we get an enormous number of data points spread evenly over a full sweep of yaw angles in a matter of minutes. That is why we still consider the wind tunnel to be the most accurate way to measure the aerodynamics of a product, especially if it is very yaw sensitive like wheels or frames
Contradictions
The whole subject of yaw is full of contradictions: For example, deep section rims benefit most from high yaw. But they are mainly used at high speeds (where yaw is typically low), and their handling is scary in crosswinds, where you would really benefit from the sailing effect. Or, lower drag at high yaw means you can go faster, which reduces yaw. Riders at lower speeds experience higher yaw and therefore benefit from the sailing effect, but at the same time drag is less relevant at these lower speeds.
What Do We Learn from That?
First, take aerodynamic test results with a grain of salt, especially weighted averages. If you want to go down the rabbit hole of aerodynamics, try to find out which yaw angles are relevant for you, for example by using the myWindsock app, and do not look at weighted averages, but at individual drag results at different yaw angles.
What we are learning is that sometimes the pursuit of good test results can distract us, and the industry as a whole, from making better products for the rider. There is no such thing as the fastest bike, it depends on the rider, the course, the tactics and even the wind conditions, which can change from day to day.